Green Spaces, Temperature and Pollution in the San Fernando Valley
Starting in the mid 20th century, the San Fernando Valley in Southern California began to transition from a mostly agricultural center to what is now one of the countries largest suburban areas.
Although farmland has mostly disappeared, I wanted to see what remained of any green space in the valley and whether any relationships existed between those spaces, the temperature throughout the valley and areas of unhealthy pollution.
Initial Data Sets
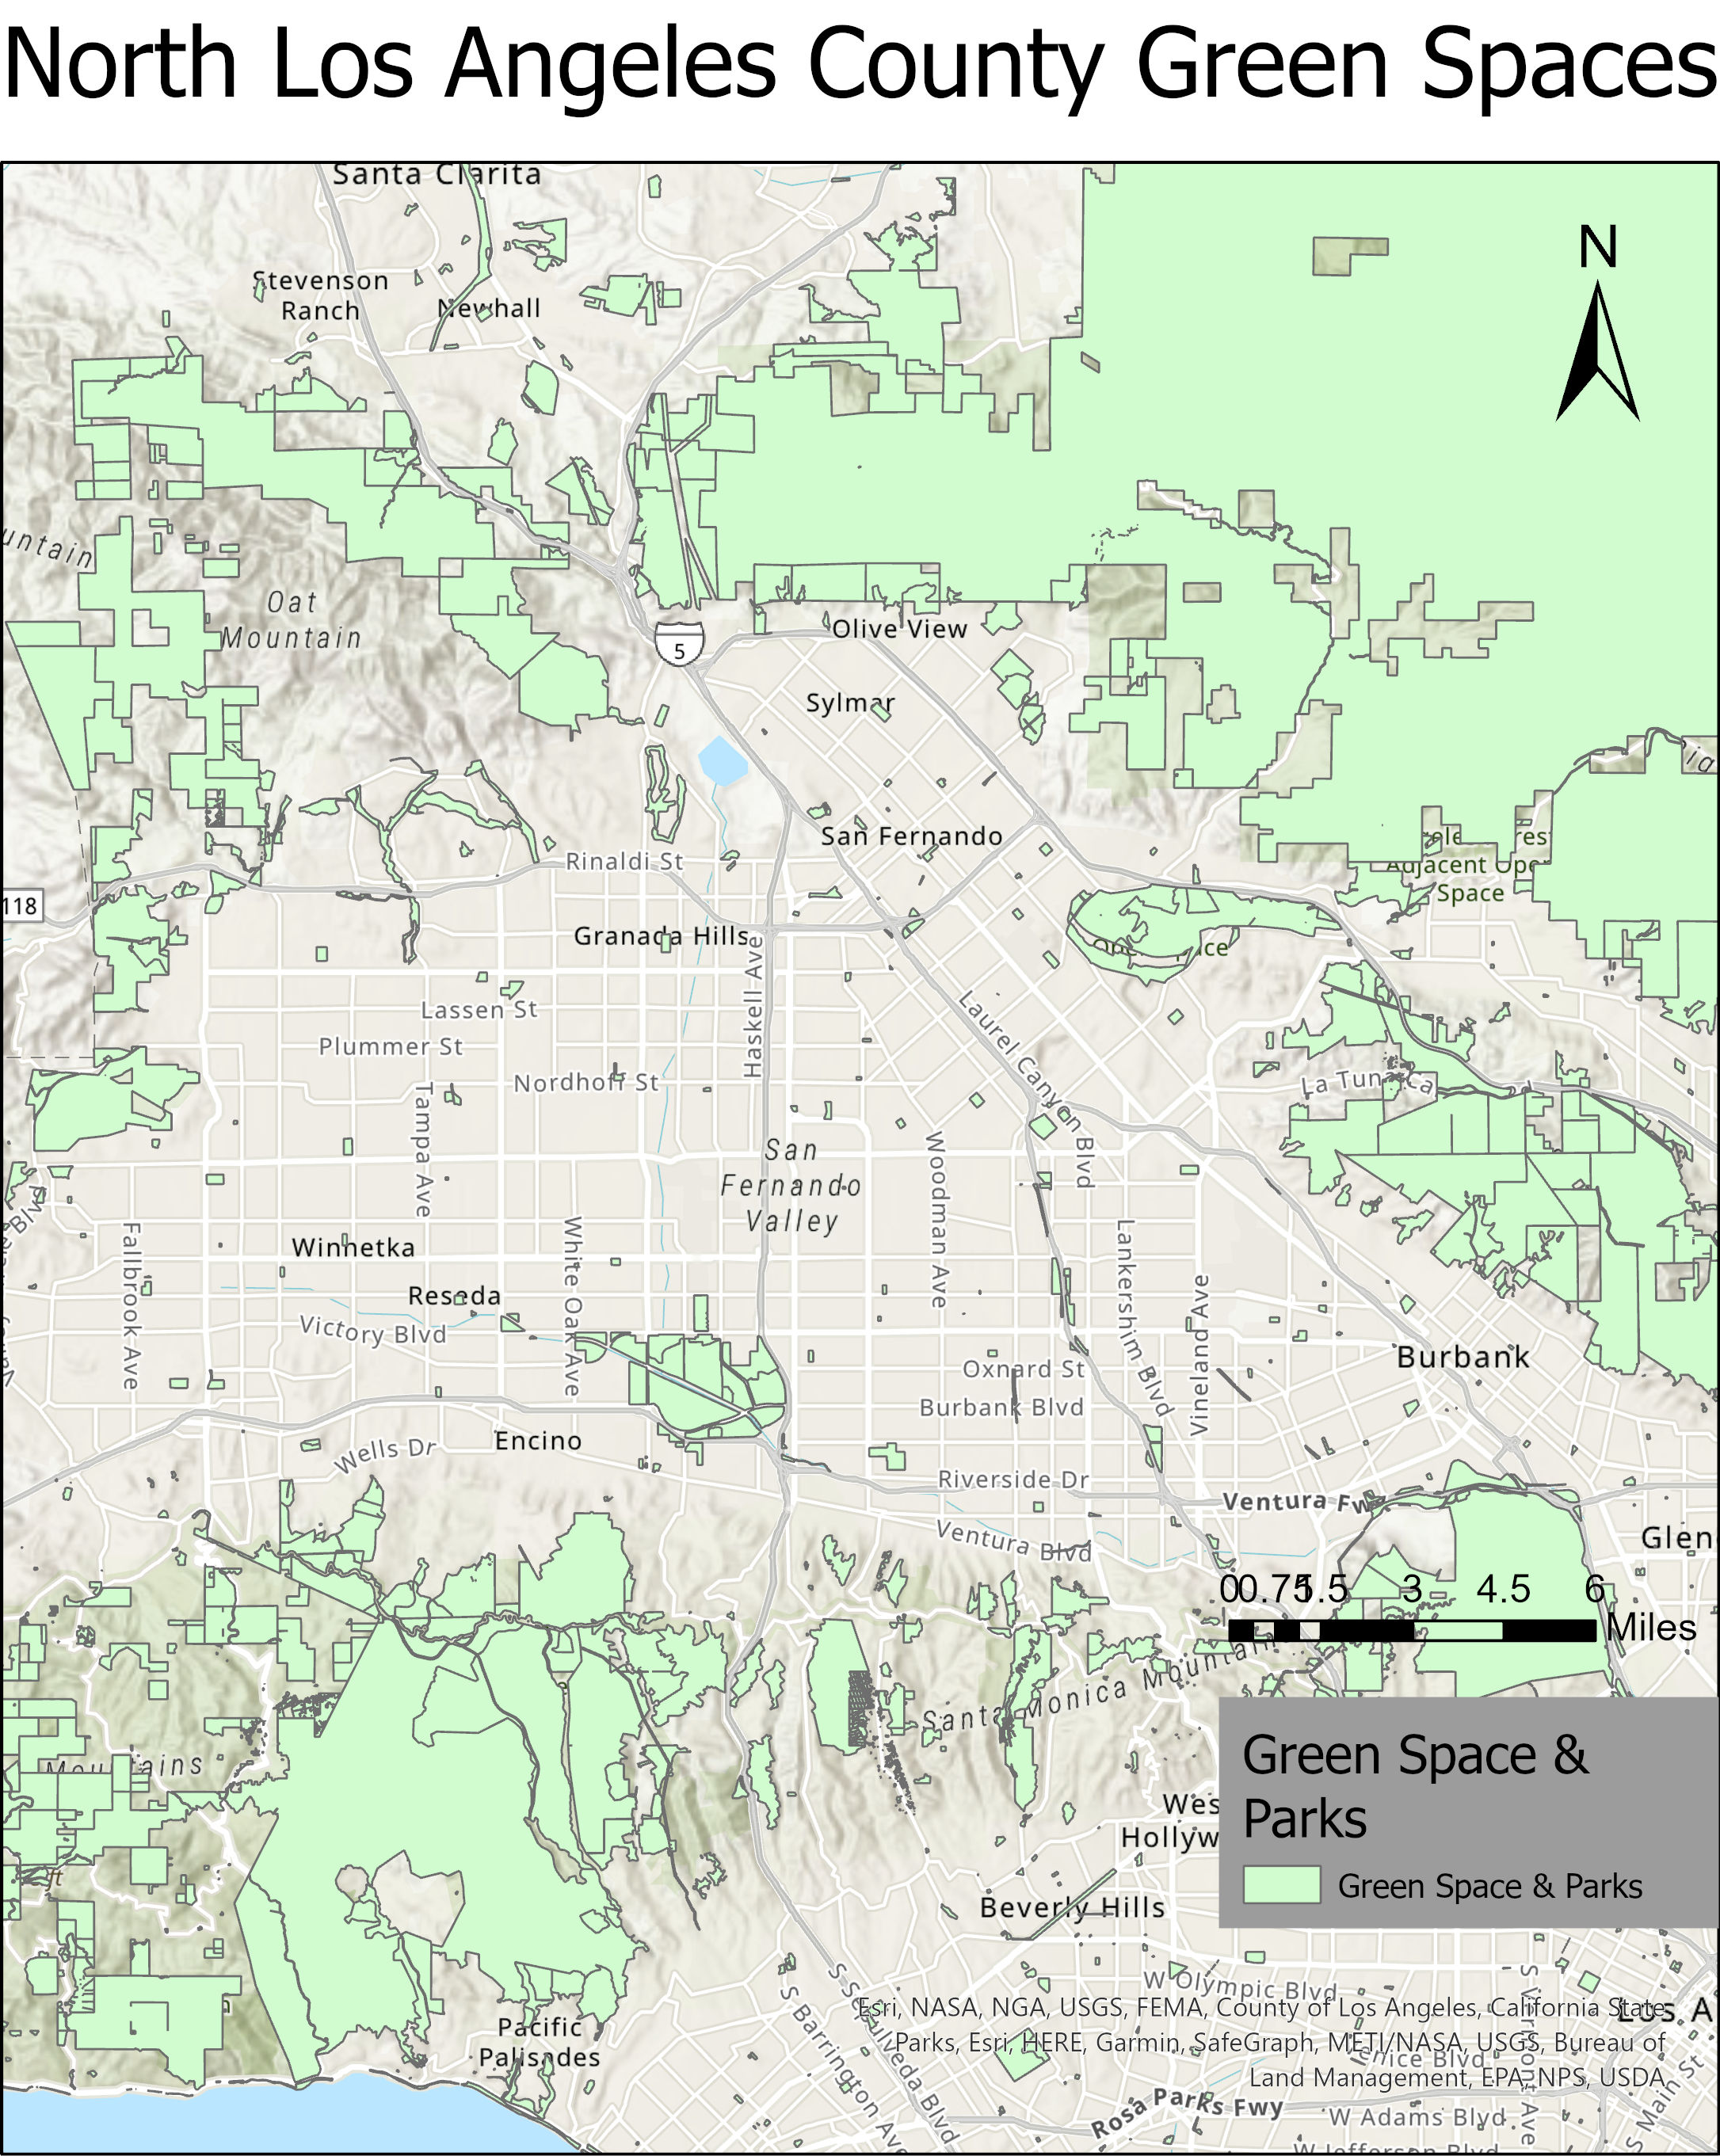
Name: Countywide Parks and Open Space
Origin: Los Angeles GeoHub
Format: Shapefile
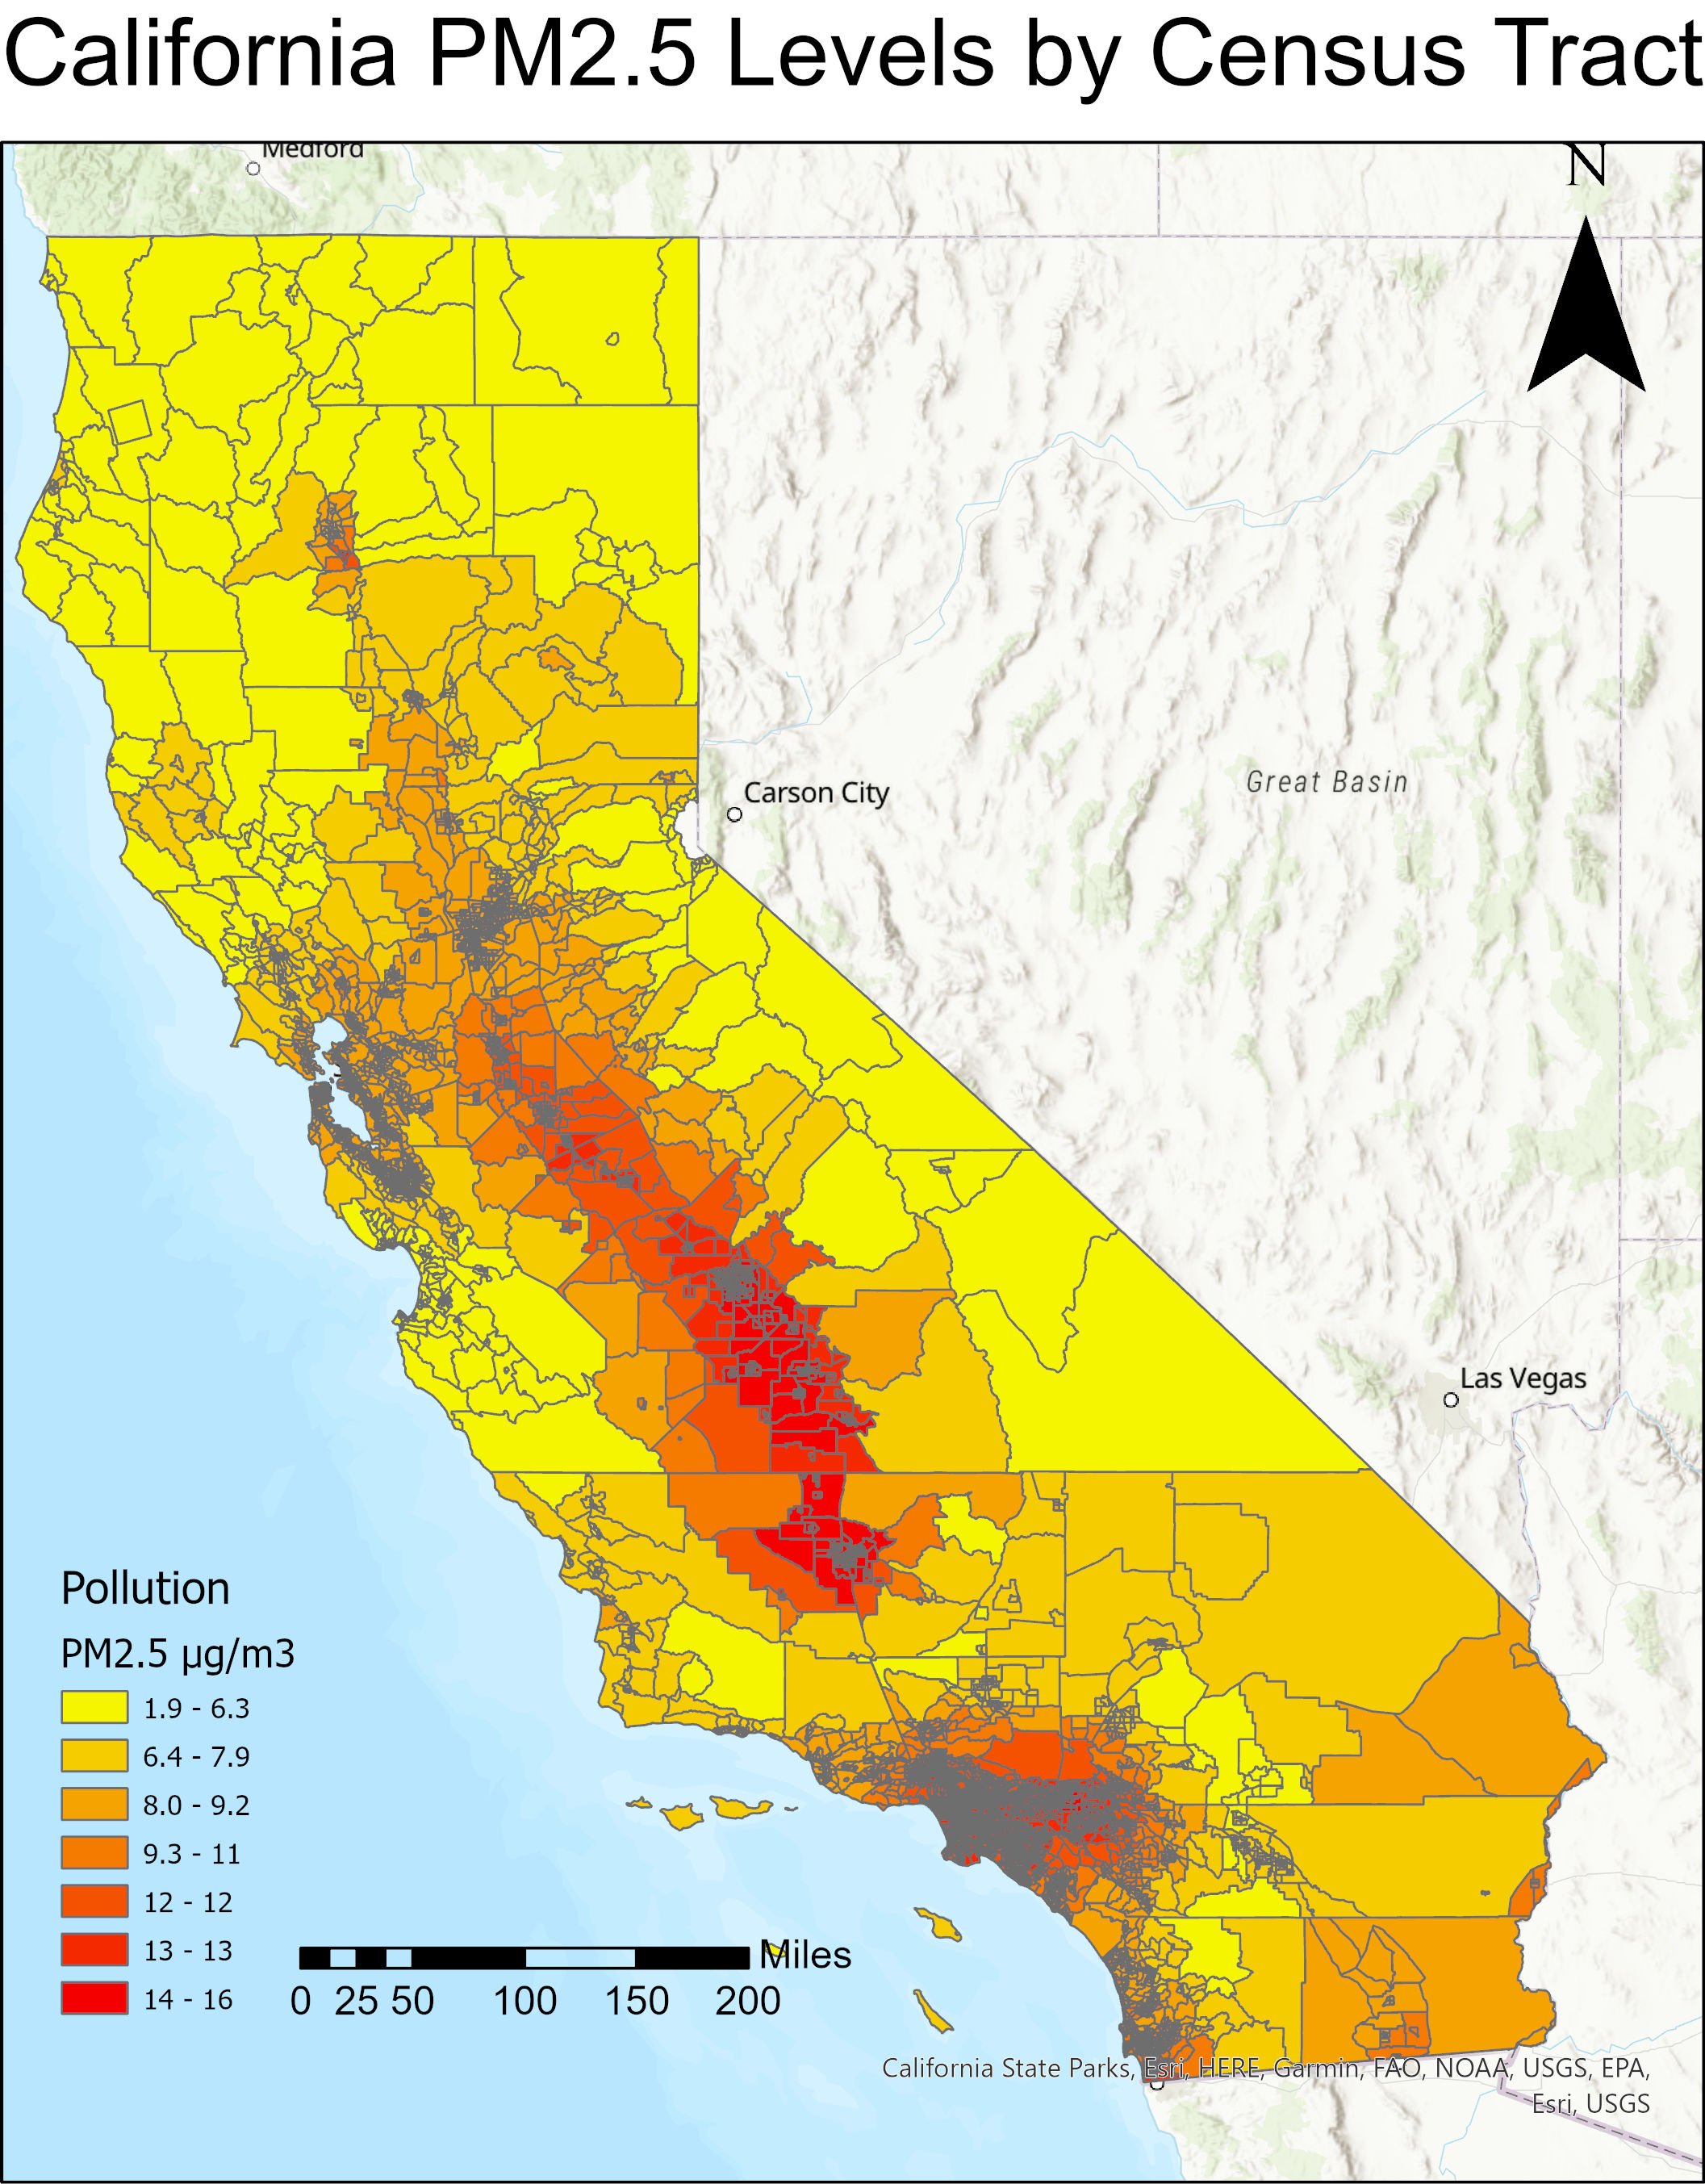
Name: CalEnviroScreen 4.0 Data
Origin: California OEHHA
Format: .gdb Geodatabase
Name: Custom Global Summary of The Year
Origin: NOAA
Format: .CSV File
Additional Data
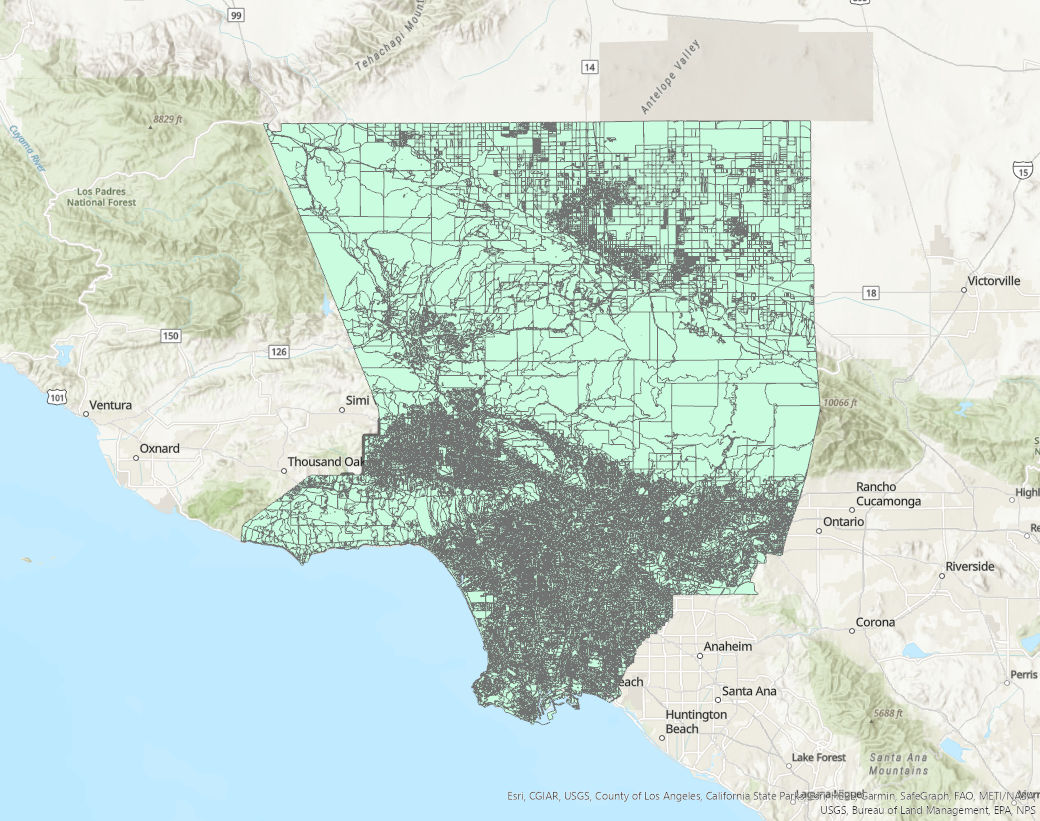
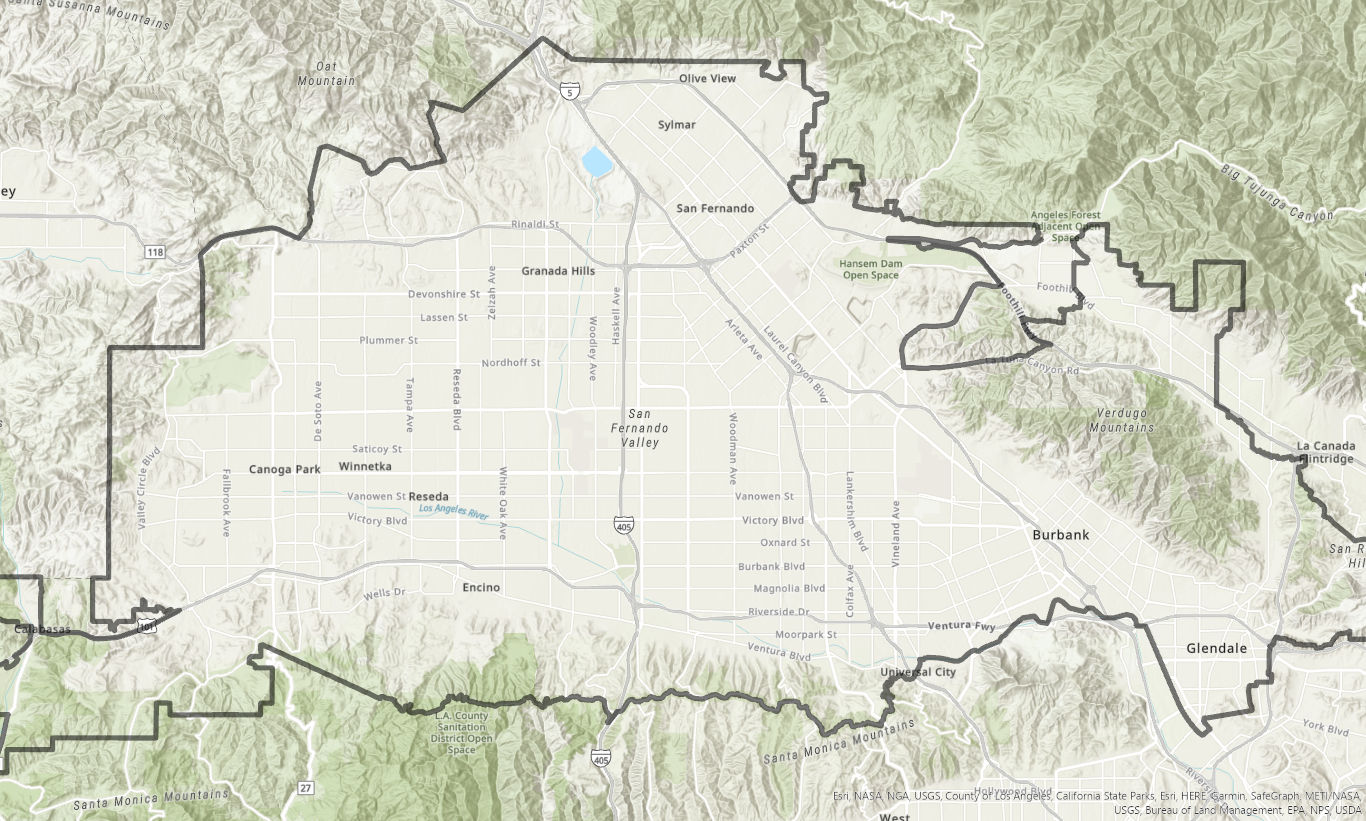
I also needed to establish the boundary of the San Fernando Valley to narrow down all the data to my area of study. I used the Census Data by Blocks for 2020 data set from the County of Los Angeles Open Data Portal and modified it by doing the following:
- I used dissolve to merge census blocks into cities
- I then manually selected the cities I wanted to include, and created a new layer from this selection
- Finally, I used dissolve boundaries on the new layer to create the outline of the San Fernando Valley
Geoprocessing
Interpolate
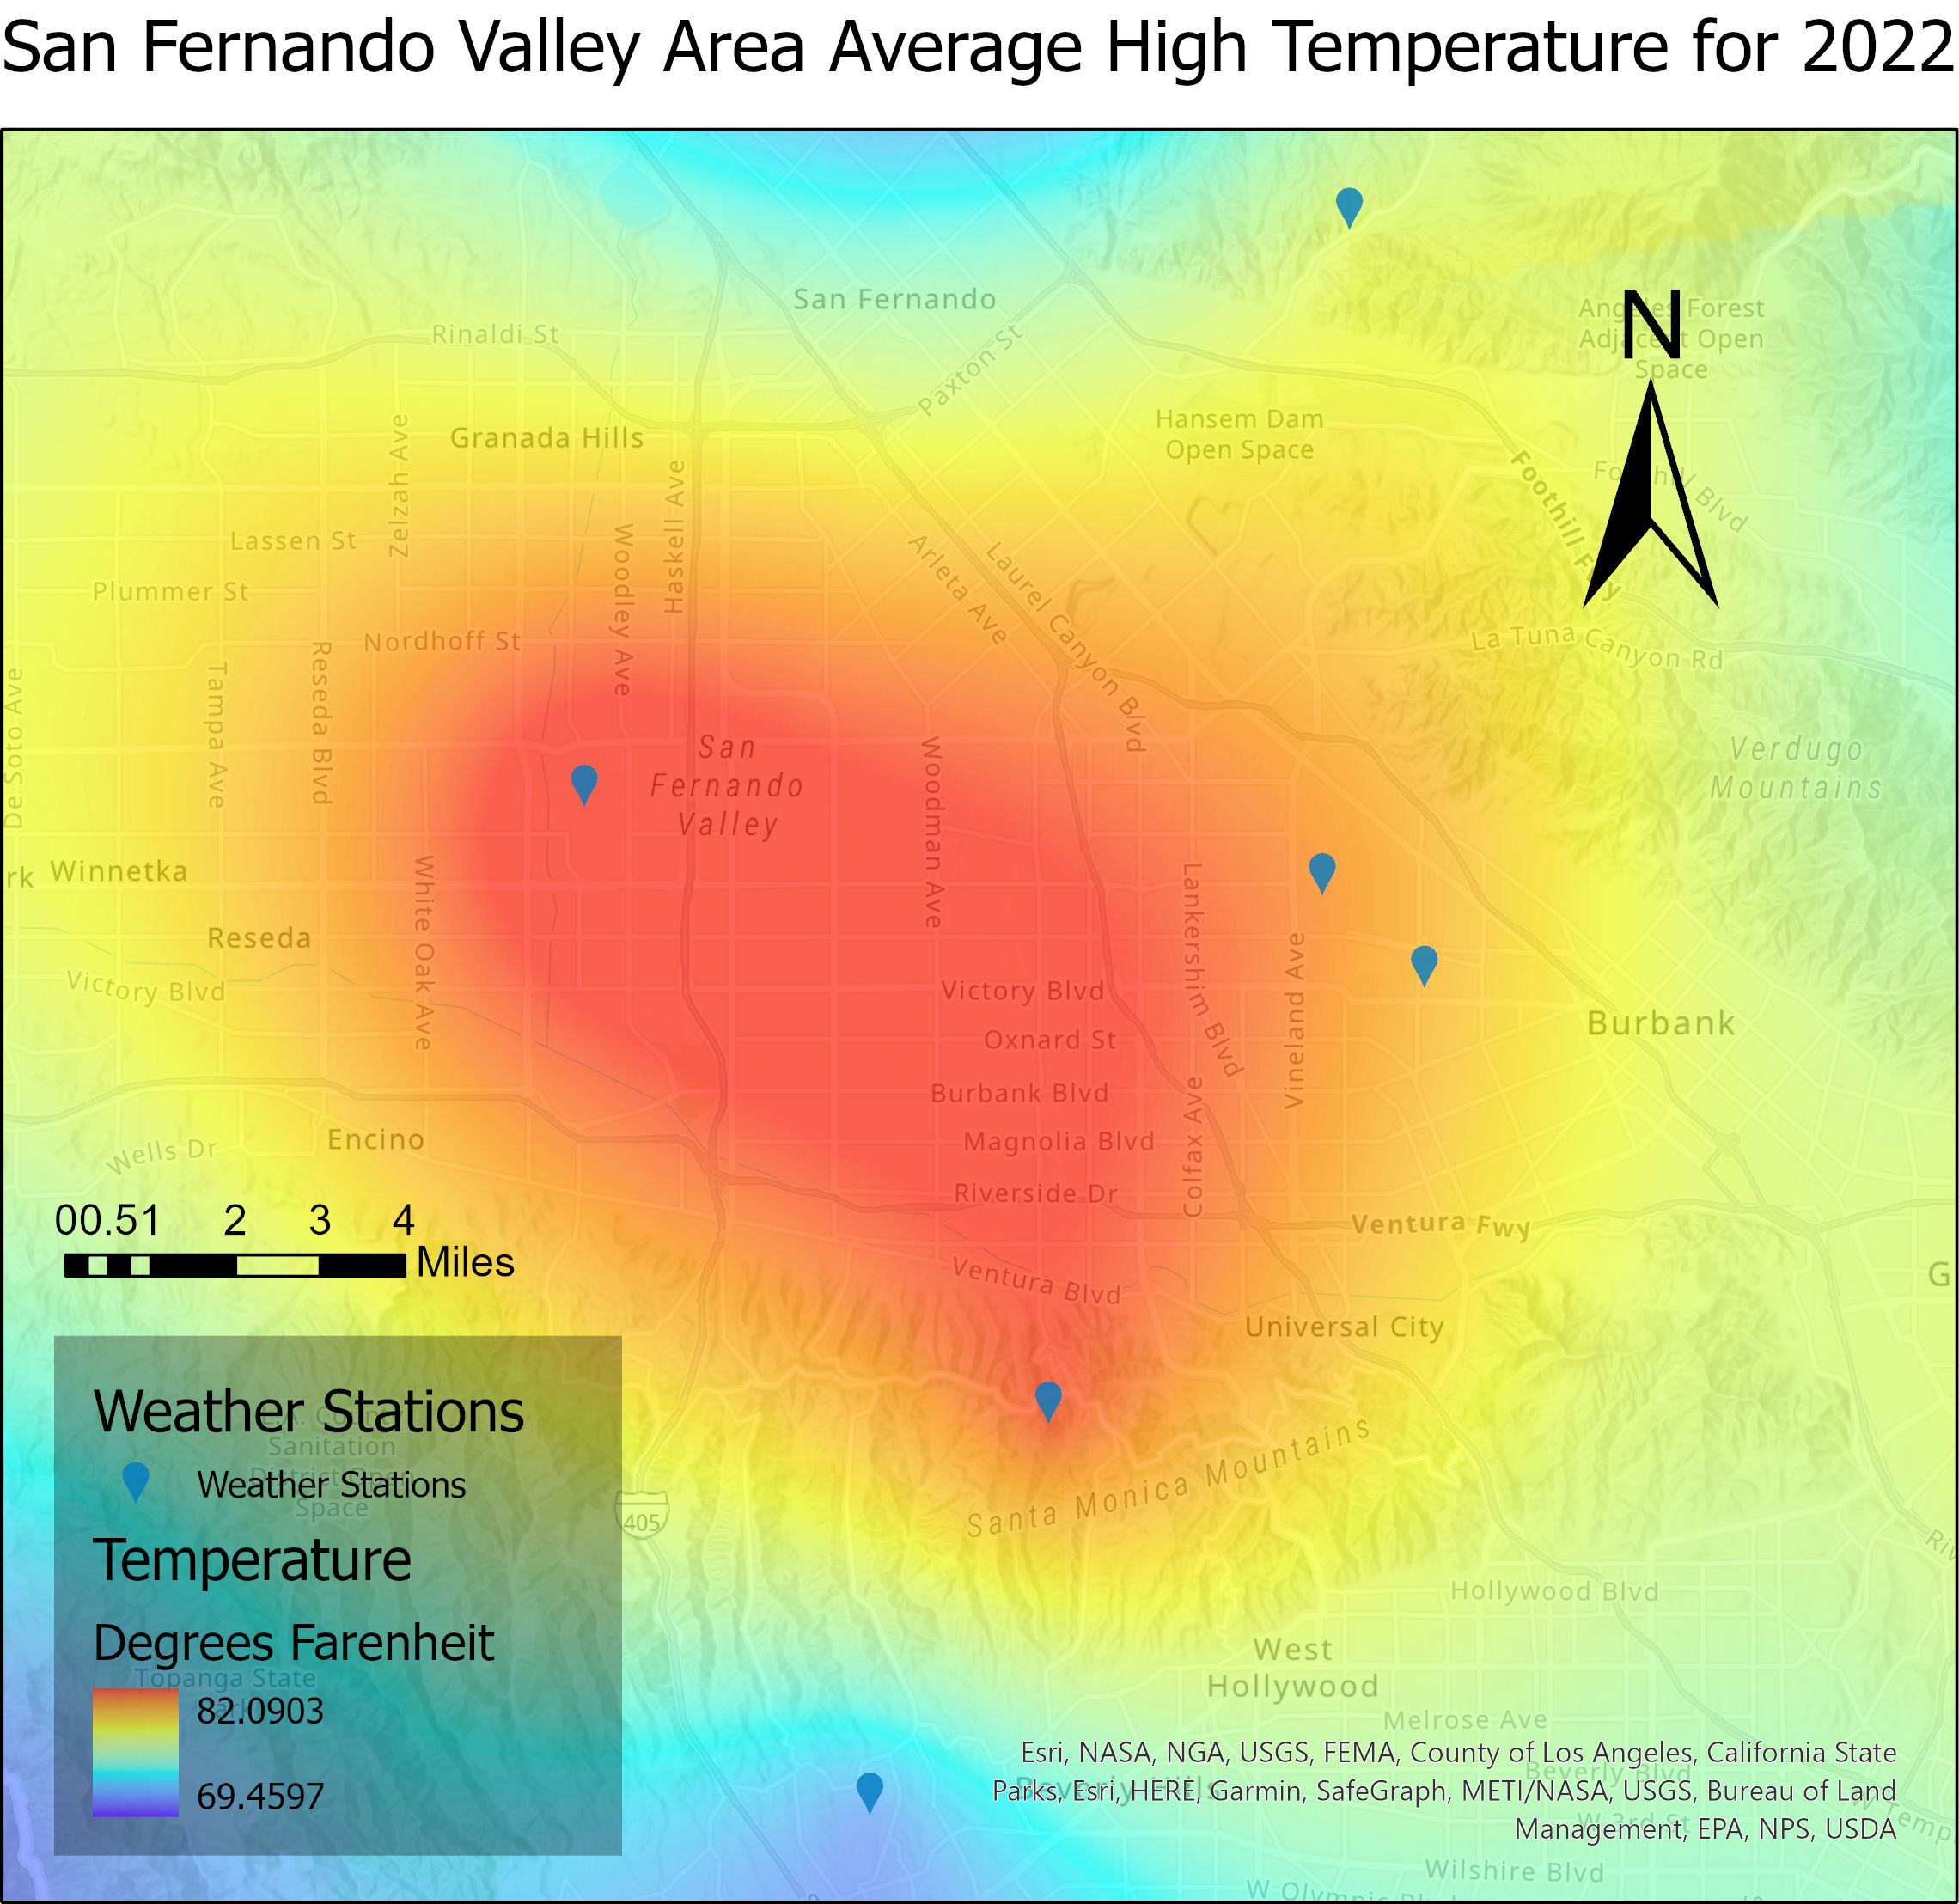
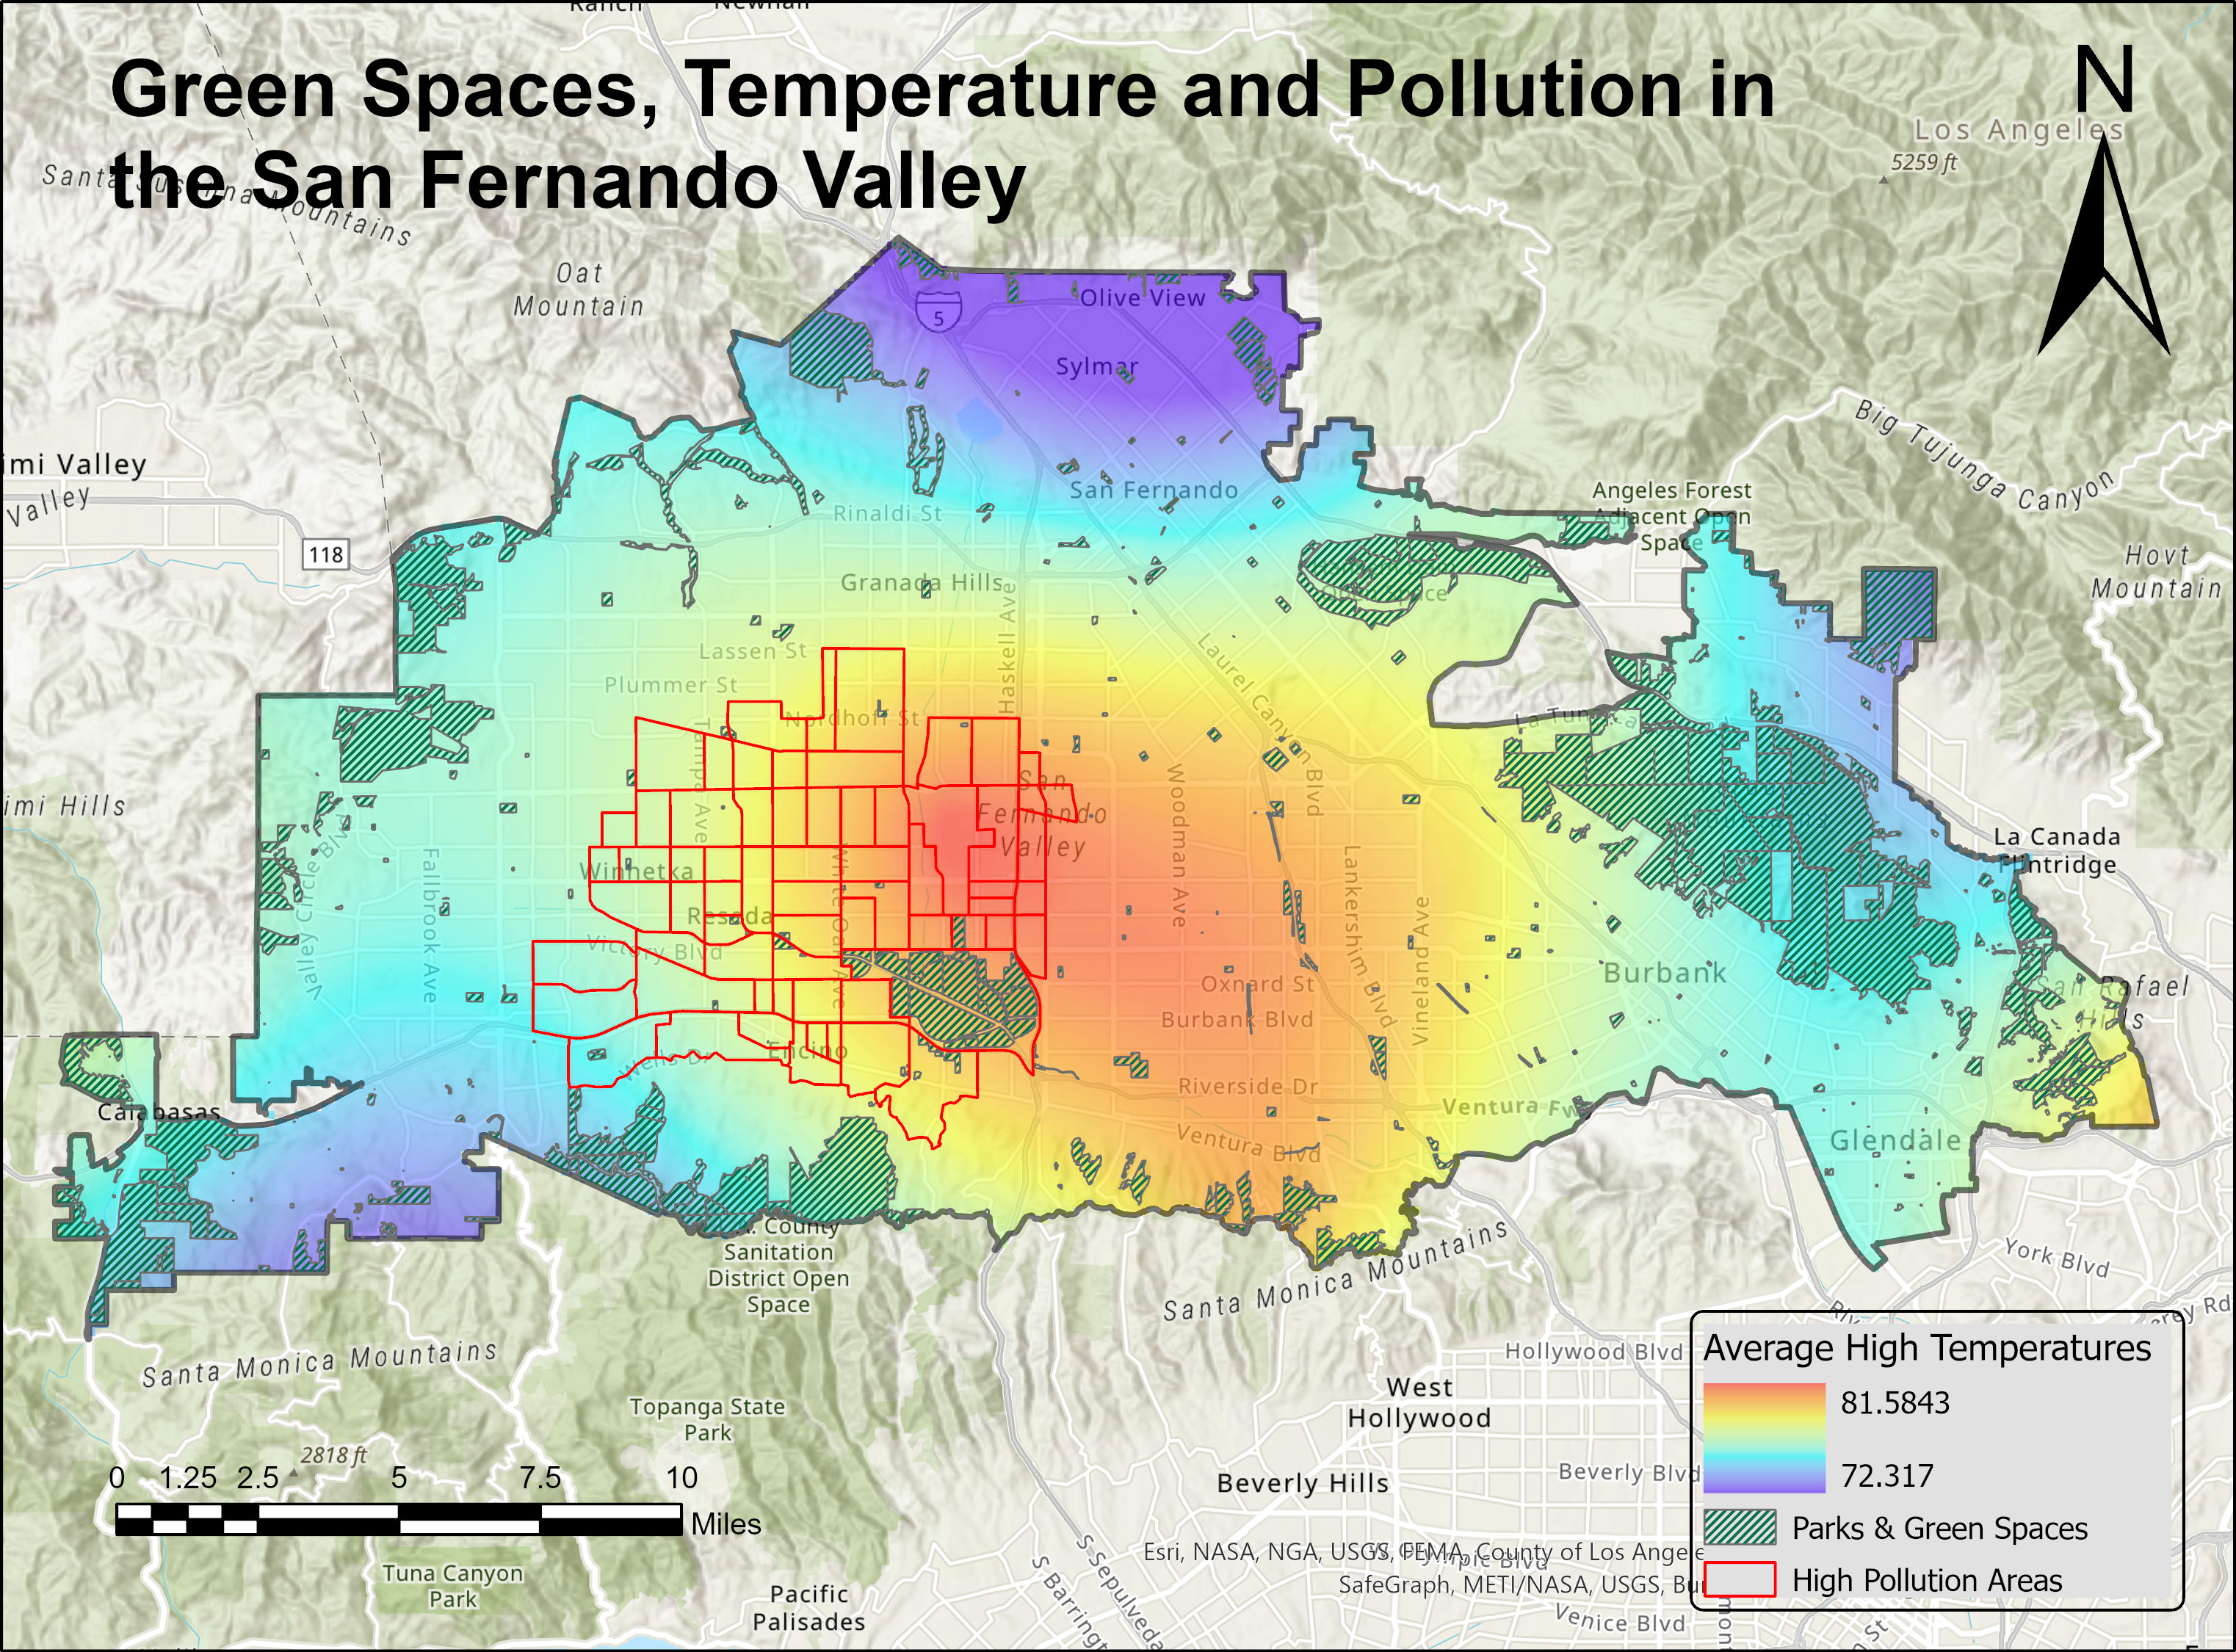
The temperature .CSV data was plotted using XY Point Data. Interpolate was then used to generate a raster temperature map using the Average High Temperature for each weather station point.
Clip
The temperature raster, Calenviroscan pollution, and the Los Angeles green spaces layers were all clipped to the San Fernando Valley layer in separate steps, creating new layers with only the information for the area of study.
Analysis
- Larger areas of green space mostly correspond to lower temperature areas. These areas tend to be along the outskirts of the valley leading into the foothill areas. The notable exception is a large golf course in the middle of a high temperature zone.
- The higher temperature areas are mostly near the center of the valley along the 405 freeway and near the Van Nuys Airport. Higher levels of pollution are also seen in this area but spreads to the west, not fully correlating with the higher temperatures seen to the east of this center area.
All maps were created using ArcGis Pro.
comments powered by Disqus